
Shoreline Real Estate Market Report – June 2026
June 2026 Market Overview
June delivered some genuinely encouraging data points. Homes sold faster than a year ago, the sold-to-list ratio exceeded last June’s figure, and price per square foot is running above 2025 levels year over year. These signals suggest that motivated buyers are still competing for the right homes. The persistent gaps in median price and overall sales volume compared to last year reflect the broader economic environment rather than a lack of demand at the right price point. Sellers who price accurately and present well are seeing strong, competitive results.

Shoreline Real Estate Market Report – MAY 2026
May 2026 Market Overview
Despite a year-over-year uptick in sales, May underperformed for what should be a peak spring month. Rising mortgage rates triggered by the Iran conflict, spiking gas prices, and growing inflation concerns combined to dampen buyer enthusiasm at a critical time. The drop from April’s activity, combined with prices and price per square foot still running below 2025 levels and days on market significantly higher than a year ago, points to a market navigating real economic headwinds. Sellers who price strategically are still achieving strong results, but the broader conditions needed to drive a true spring surge have not materialized.

Shoreline Real Estate Market Report – APRIL 2026
April 2026 Market Overview
Sales activity strengthened in April with a clear month-to-month and year-over-year increase. Homes are selling faster, signaling solid demand, but prices and price per square foot remain below last year’s levels. The market continues to normalize, with less aggressive bidding and more balanced conditions between buyers and sellers.

Shoreline Real Estate Market Report – MARCH 2026
March 2026 Market Overview
March reflects a market that is gaining seasonal momentum but remains more balanced than a year ago. Sales activity increased from February, and homes are selling more quickly, but overall volume is still lower than 2025 levels.
Prices rebounded month over month, though both median price and price per square foot remain below last year’s levels. At the same time, reduced sold-to-list ratios point to less aggressive competition among buyers.
Overall, Shoreline’s market is transitioning into the spring season with improving activity, but in a more measured and value-conscious environment than the highly competitive conditions seen in 2025.

Shoreline Real Estate Market Report – FEBRUARY 2026
FEBRUARY 2026 Market Overview
February brought a notable increase in sales activity compared with last year, pointing to improving buyer engagement as the market heads toward spring. Median prices declined year over year, though price per square foot remains slightly higher, suggesting stable underlying values. Homes are taking longer to sell than they did during last year’s faster market, but buyers are still paying very close to list price. Overall, the data points to a market that is active but more balanced than the tight conditions seen last year.

Shoreline Real Estate Market Report – JANUARY 2026
JANUARY 2026 Market Overview
January points to a market that is stable but measured. Sales volume improved compared to last year, price per square foot strengthened, and buyers remained active when properties were priced and presented well. At the same time, longer days on market and a lower median price highlight that affordability concerns and economic caution are still influencing behavior.
As the spring market approaches, these early indicators suggest gradual momentum building rather than rapid change. Buyers and sellers who stay aligned with current conditions should find balanced opportunities in the months ahead.

Shoreline Real Estate Market Report – DECEMBER 2025
DECEMBER 2025 Market Overview
Year End Takeaway
While sales volume declined meaningfully in 2025, pricing proved remarkably steady. The identical year over year median price underscores that Shoreline continues to benefit from strong long-term demand, even in a more challenging interest rate environment.
Buyers have had more time and leverage than in recent years, while sellers have needed to price thoughtfully and prepare homes carefully to achieve strong results. As the market moves into 2026, Shoreline enters the new year balanced, with stable values and opportunities on both sides for those aligned with current conditions.

Shoreline Market Trends December
Shoreline Real Estate Market Report – NOVEMBER 2025
NOVEMBER 2025 Market Overview
Summary
The Shoreline market in November 2025 continued to reflect a steady, price-conscious environment. While sales volume is down and days on market are up, pricing has held firm overall — with median and per-square-foot prices only slightly below 2024 levels.
Buyers remain cautious amid economic uncertainty and elevated mortgage rates, but well-priced listings are still selling near asking, and November’s price-per-foot rebound shows demand for quality homes remains. As the year winds down, Shoreline is closing out 2025 in a balanced, stable position, with opportunities for both buyers and sellers who are aligned with current market realities.

Shoreline Market Trends
For complete details, visit https://lellanorberg.com/2025/12/07/november-2025-shoreline-real-estate-market-update
Shoreline Real Estate Market Report – OCTOBER 2025
OCTOBER 2025 Market Overview
Summary
October 2025 reflects a market that is cooler than last year, but generally stable. While sales volume remains significantly lower year-over-year, pricing has held firm: the median price is unchanged from 2024, and homes are still selling close to list price.
That said, the drop in price per square foot and the increase in days on market point to more selective buyer behavior, influenced by affordability concerns, higher interest rates, and broader economic uncertainty.
As we move into late fall, sellers should expect longer timelines and more price sensitivity, while buyers may find more flexibility and negotiation room — especially on homes that linger.

Shoreline Real Estate Market Report – SEPTEMBER 2025
SEPTEMBER 2025 Market Overview

Shoreline Real Estate Market Report – AUGUST 2025
AUGUST 2025 Market Overview
August 2025 closed with 35 home sales, up from 31 in July but down 31% year-over-year compared to 51 sales in August 2024. This continues the theme of 2025: a slower pace of transactions compared to last year, even though month-over-month activity ticked up slightly.
Median Price
The median price rose to $890,000 in August from $830,000 in July, but is still 2.2% below August 2024’s $910,000. This reflects a rebound from July’s softer pricing, but on a yearly basis, values remain modestly lower.
Price per Square Foot
The average price per square foot fell to $512, down sharply from $542 in July and slightly below $515 in August 2024 (a 0.6% YoY decrease). This suggests that while the median price improved month over month, buyers may be purchasing larger homes or negotiating more value per square foot.
Days on Market
Homes are taking longer to sell. In August 2025, the average days on market increased to 26, up from 21 in July and 63% higher than the 16-day average in August 2024. This indicates a shift toward more measured buyer decision-making.
Sold-to-List Price Ratio
Homes are still selling close to asking, but the gap compared to 2024 has widened:
-
2025 YTD ratio: 99.94%
-
2024 ratio: 102.11%
This confirms bidding intensity has eased, and buyers now have slightly more negotiating room.
Summary
August 2025 shows a market that is slower and more value-driven than last year. Sales remain well below 2024 levels, homes are taking longer to sell, and buyers are paying slightly less relative to list prices than before. While median prices rebounded strongly from July, the decrease in price per square foot and list-to-sale ratios reflects affordability pressures, higher interest rates, and economic uncertainty weighing on buyer urgency.
The Shoreline market is still active and homes are selling at near-list prices, but sellers are no longer seeing the same level of competition as in 2024 and need to price strategically to secure offers in a more deliberate market.

Shoreline Real Estate Market Report – JULY 2025
JULY 2025 Market Overview
Sales Volume
July 2025 saw a steep drop in activity, with just 31 homes sold, down from 45 in June and a 36.7% decrease year-over-year compared to 49 sales in July 2024.
Year-to-date, total sales stand at 235, a 14.5% decline from 275 sales during the same period in 2024. This slowdown in buyer activity is influenced by a combination of affordability concerns, elevated interest rates, and an uncertain economic outlook, all of which have caused many buyers to proceed more cautiously or delay purchasing decisions.
As of July 31, 2025, there were 36 active listings in Shoreline — a relatively low inventory level that may be limiting options for motivated buyers and contributing to reduced sales despite some underlying demand.
Median Price
The median sale price in July dropped to $830,000, down from $880,000 in June, and 1.2% below July 2024’s $840,000.
Still, the year-to-date median price holds steady at $850,000, nearly matching $849,850 in 2024, indicating that overall home values have remained resilient despite month-to-month fluctuations.
Price per Square Foot
The average price per square foot rose to $542 in July, up from $505 in June, but still down 4.7% from $569 in July 2024.
Year-to-date, price per square foot is $536, an improvement over $524 in 2024, suggesting that buyers are still willing to pay for quality and location, even as broader affordability pressures weigh on the market.
Days on Market
Homes took an average of 21 days to sell in July, up slightly from 18 in June and just above 20 in July 2024.
Year-to-date, homes are taking an average of 25 days to sell, compared to 26 days in 2024, showing a consistent pace overall, though the longer July timeline reflects slightly slower buyer decision-making.
List-to-Sale Price Ratio
Buyers are gaining more negotiating power.
-
In July 2025, homes sold at 100.69% of list price, compared to 101.01% in July 2024.
-
Year-to-date, the ratio is 102.45%, down slightly from 103.06% in 2024.
While sellers are still generally achieving full asking price, bidding wars are less frequent, and buyers are negotiating with more confidence.
Summary
The Shoreline market cooled in July, with sales volume down significantly, prices softening, and buyer urgency slowing. While year-to-date pricing remains stable, the shift in sales activity and list-to-sale ratios reflects growing buyer caution.
A combination of high interest rates, affordability challenges, and broader economic uncertainty is dampening demand. At the same time, limited inventory — with just 36 active listings at the end of July — continues to constrain the market.
As we head into late summer, sellers should focus on accurate pricing and strong presentation, while buyers may find more negotiating room in a market that is clearly tilting toward balance.

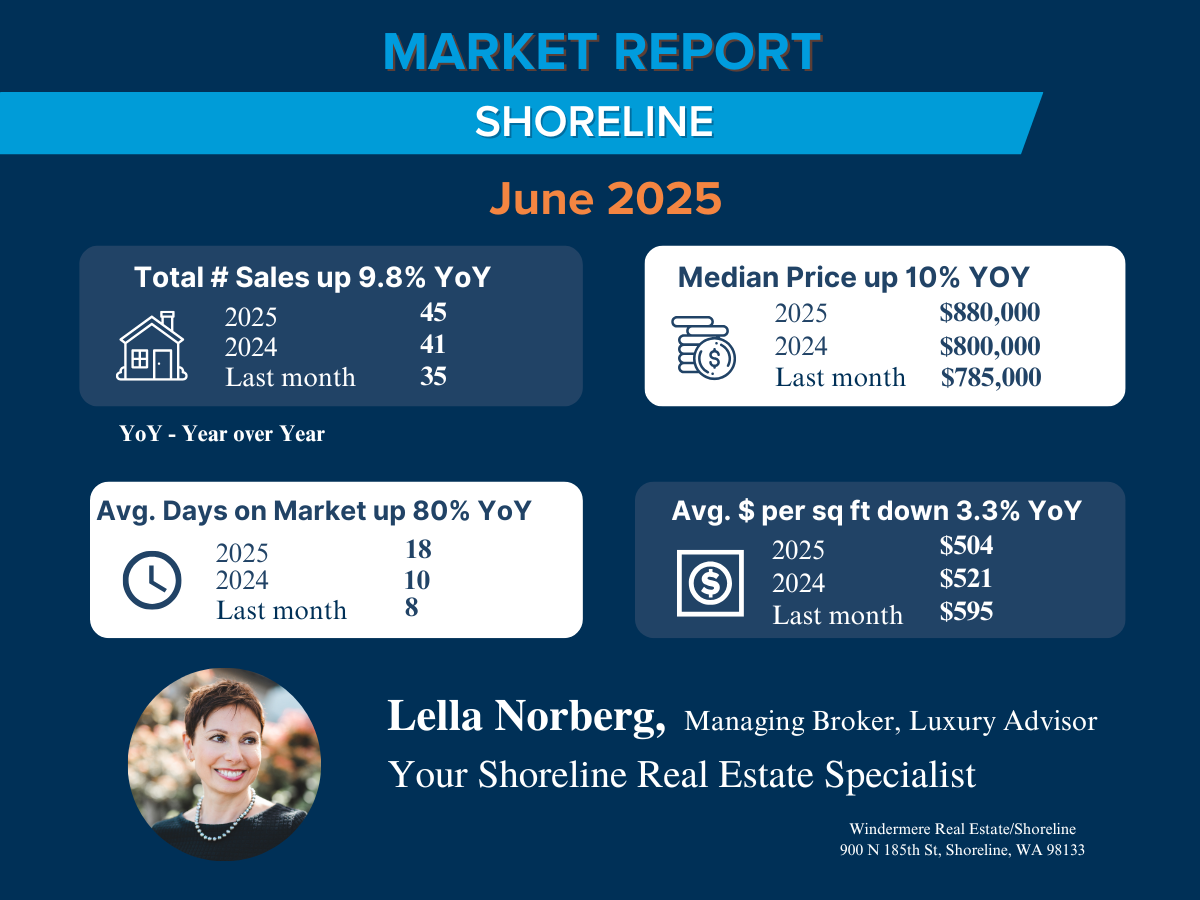
Shoreline Real Estate Market Report – JUNE 2025
JUNE 2025 Market Overview
Shoreline Real Estate Market Report – May 2025
MAY 2025 Market Overview
Total sales dropped to 35 homes sold, a 27% decrease year-over-year (from 48 in May 2024) and a noticeable decline from April’s 44 sales. Despite a strong April, May showed signs of cooling in buyer activity. On a year-to-date basis, sales reached 158, which is still down from 186 at this point in 2024, reinforcing the narrative of a softer start to 2025.
The median sale price in May fell sharply to $785,000, a 13% YoY decrease and a significant dip from $903,000 in April. This suggests that more modestly priced homes made up a larger share of May’s sales or that buyers are responding to affordability concerns. However, the YTD median price remains ahead of 2024 at $850,000 vs. $845,000, indicating stronger pricing earlier in the year has helped buoy the overall average.
Interestingly, average price per square foot surged to $595, up 11.4% from May 2024 ($534) and well above last month’s $535. This suggests buyers may be paying more per square foot for smaller or more updated homes, even while overall median prices dropped—often a signal of changing buyer priorities or a shift in product mix.
Homes in May sold much faster, averaging just 8 days on the market, which is a dramatic improvement from 37 days in April and even faster than May 2024’s 10-day average. Year-to-date, the average is 28 days, down from 38 days in 2024, reflecting improved buyer urgency in the spring months despite lower sales volume.

As seen in Shoreline Area News: https://www.shorelineareanews.com/2025/06/shoreline-real-estate-market-may-2025.html
#shorelinerealestate #shorelinerealestateagent #bestrealestateagents #bestrealestateagentshoreline #shorelinemarkettrends
Shoreline Real Estate Market Report – APRIL 2025
APRIL 2025 Market Overview
The Shoreline real estate market showed signs of renewed activity this month as we enter the spring selling season. In April 2025, total home sales rose by 19% year-over-year, indicating a rebound in buyer demand after a slower start to the year. Prices remained stable, with the median home price holding virtually flat at around $903,000, and the average price per square foot nudging up 1.7% from the previous year.
However, homes took longer to sell in April 2025, with average days on market increasing by 37% compared to April 2024—suggesting that while demand has improved, buyers may be more cautious.
Compared to last month (March 2025), activity remained essentially flat in terms of total sales (44 vs. 43). The median price dropped slightly from $960,000 to $903,000, possibly reflecting a shift in the mix of homes sold or some softening in buyer competition. The average price per square foot also dipped from $558 to $535, aligning with the median price movement. Meanwhile, the average days on market increased notably, from 27 in March to 37 in April, which could reflect seasonal factors like increase in inventory.

As seen in Shoreline Area News: https://www.shorelineareanews.com/2025/05/april-real-estate-report.html
#lellanorberg #shorelinerealestate #shorelinerealestateagent #windermere #bestrealestateagents #bestrealestateagentshoreline #shorelinemarkettrends
Shoreline Real Estate Market Report – MARCH 2025
MARCH 2025 Market Overview
-
Sales: Flat – 43 sales vs 44 in 2024
-
Median Price: Up 18% – $960,000 vs $812,886
-
Avg. $/Sq Ft: Up 12% – $558 vs $498
-
Days on Market: Up 37% – 27 days vs 19 daysWhile the number of homes sold held steady compared to last year, prices surged significantly. The 18% rise in median price and 12% increase in price per square foot reflect strong buyer demand. However, the longer time on market (up 37%) suggests that buyers may be more selective or cautious amid higher prices — a sign of a shifting dynamic where pricing strategy and presentation matter more than ever.


As seen in Shoreline Area News: https://www.shorelineareanews.com/2025/04/march-real-estate-statistics.html
#lellanorberg #shorelinerealestate #shorelinerealestateagent #windermere #bestrealestateagents #bestrealestateagentshoreline #shorelinemarkettrends
Shoreline Real Estate Market Report – FEBRUARY 2025
FEBRUARY 2025 Market Overview
The real estate market data reveals a decline in key metrics year over year (YoY):
Total Sales Decline: Sales have decreased by 23% YoY, from 26 transactions in 2024 to 20 in 2025. However, there is an increase compared to last month’s 15 sales.
Several factors may be influencing the number of sales:
- High Interest Rates: The increase in interest rates has made housing less affordable, resulting in fewer buyers entering the market.
- Economic Uncertainty: Concerns about job stability, inflation, and other economic factors are reducing buyer confidence.
- Typical Seasonal Fluctuations: Sales often slow during winter before increasing in the peak spring buying season.
Median Price Decrease: The median price has declined by 6.7% YoY, from $830,150 in 2024 to $774,500 in 2025. This represents a further decrease from last month’s $799,000.
Price Per Square Foot Slightly Down: The average price per square foot has decreased by 1.2% YoY, from $505 in 2024 to $499 in 2025. Nevertheless, it remains higher than last month’s $474.
Days on Market Improved: Homes are selling faster, with the average days on the market down by 43% YoY, from 51 days in 2024 to 29 days in 2025. This also marks an improvement from last month’s 48 days.

As seen in Shoreline Area News: https://www.shorelineareanews.com/2025/03/february-2025-shoreline-real-estate.html
#lellanorberg #shorelinerealestate #shorelinerealestateagent #windermere #bestrealestateagents #bestrealestateagentshoreline #shorelinemarkettrends
Shoreline Real Estate Market Report – JANUARY 2025
JANUARY 2025 Market Overview
-
Sales Volume Decline – The total number of sales dropped 40% year over year (YoY), from 25 sales in January 2024 to just 15 in January 2025. Additionally, sales fell sharply from 44 transactions last month, suggesting a seasonal slowdown.
-
Median Price Drop – The median sale price fell by 7.6% YoY, from $865,000 in 2024 to $799,000 in 2025. This also represents a decline from last month’s $844,367, indicating downward price pressure.
-
Price per Square Foot Decrease – The average price per square foot declined by 3.5% YoY, from $491 in 2024 to $474 in 2025. This suggests buyers negotiating better deals during our seasonally slow market.
-
Days on Market Improving – The average time to sell a home decreased by 23% YoY, from 62 days in 2024 to 48 days in 2025. While homes are selling faster compared to last year, the increase in days on market from last month suggests shifting demand dynamics, possibly due to affordability constraints or a changing buyer mindset.

As seen in Shoreline Area News: https://www.shorelineareanews.com/2025/02/january-2025-shoreline-real-estate.html

#lellanorberg #shorelinerealestate #shorelinerealestateagent #windermere #bestrealestateagents #bestrealestateagentshoreline #shorelinemarkettrends
